BC3203
Expected outputs for Tutorial 6 exercises
Question 1: Your answer should be a function read_gff. If you run your function like this it should produce output as shown below
read_gff("cache/human_genes.gff")
## # A tibble: 42,220 × 9
##    seqid        source     type   start    end score strand phase attributes
##    <chr>        <chr>      <chr>  <dbl>  <dbl> <chr> <chr>  <chr> <chr>
##  1 NC_000001.11 BestRefSeq gene   17369  17436 .     -      .     ID=gene-MIR68…
##  2 NC_000001.11 Gnomon     gene   29926  31295 .     +      .     ID=gene-MIR13…
##  3 NC_000001.11 BestRefSeq gene   30366  30503 .     +      .     ID=gene-MIR13…
##  4 NC_000001.11 BestRefSeq gene   34611  36081 .     -      .     ID=gene-FAM13…
##  5 NC_000001.11 BestRefSeq gene   65419  71585 .     +      .     ID=gene-OR4F5…
##  6 NC_000001.11 Gnomon     gene   89006 267354 .     -      .     ID=gene-LOC10…
##  7 NC_000001.11 BestRefSeq gene  134773 140566 .     -      .     ID=gene-LOC72…
##  8 NC_000001.11 BestRefSeq gene  187891 187958 .     -      .     ID=gene-MIR68…
##  9 NC_000001.11 Gnomon     gene  200442 203983 .     +      .     ID=gene-LOC10…
## 10 NC_000001.11 Gnomon     gene  350706 476822 .     -      .     ID=gene-LOC11…
## # ℹ 42,210 more rows
Question 2: Your answer should produce a tibble that looks like this;
## # A tibble: 42,220 × 10
##    seqid        source  type   start    end score strand phase attributes length
##    <chr>        <chr>   <chr>  <dbl>  <dbl> <chr> <chr>  <chr> <chr>       <dbl>
##  1 NC_000001.11 BestRe… gene   17369  17436 .     -      .     ID=gene-M…     67
##  2 NC_000001.11 Gnomon  gene   29926  31295 .     +      .     ID=gene-M…   1369
##  3 NC_000001.11 BestRe… gene   30366  30503 .     +      .     ID=gene-M…    137
##  4 NC_000001.11 BestRe… gene   34611  36081 .     -      .     ID=gene-F…   1470
##  5 NC_000001.11 BestRe… gene   65419  71585 .     +      .     ID=gene-O…   6166
##  6 NC_000001.11 Gnomon  gene   89006 267354 .     -      .     ID=gene-L… 178348
##  7 NC_000001.11 BestRe… gene  134773 140566 .     -      .     ID=gene-L…   5793
##  8 NC_000001.11 BestRe… gene  187891 187958 .     -      .     ID=gene-M…     67
##  9 NC_000001.11 Gnomon  gene  200442 203983 .     +      .     ID=gene-L…   3541
## 10 NC_000001.11 Gnomon  gene  350706 476822 .     -      .     ID=gene-L… 126116
## # ℹ 42,210 more rows
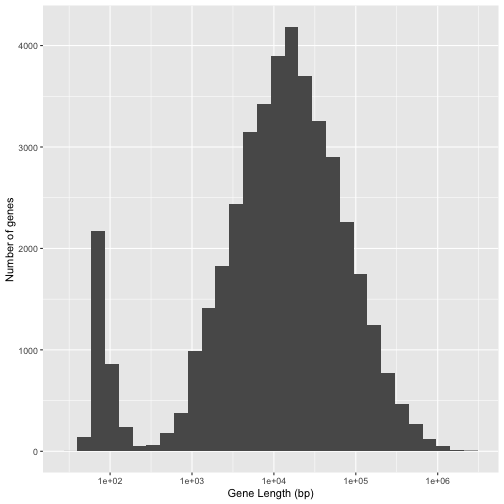
Question 3: Your answer should produce a plot that looks like this;
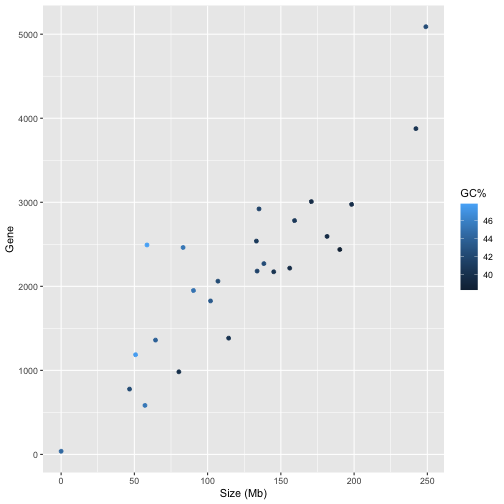
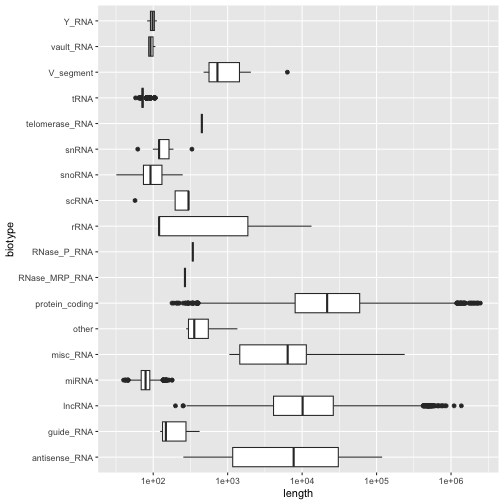
Question 4: Your answer should produce a plot that looks like this;
Question 5: Your answer should produce a tibble that looks like this;
## # A tibble: 37,478 × 20
##    seqid    source type   start    end score strand phase attributes Type  Name
##    <chr>    <chr>  <chr>  <dbl>  <dbl> <chr> <chr>  <chr> <chr>      <chr> <chr>
##  1 NC_0000… BestR… gene   17369  17436 .     -      .     ID=gene-M… Chr   1.0
##  2 NC_0000… Gnomon gene   29926  31295 .     +      .     ID=gene-M… Chr   1.0
##  3 NC_0000… BestR… gene   30366  30503 .     +      .     ID=gene-M… Chr   1.0
##  4 NC_0000… BestR… gene   34611  36081 .     -      .     ID=gene-F… Chr   1.0
##  5 NC_0000… BestR… gene   65419  71585 .     +      .     ID=gene-O… Chr   1.0
##  6 NC_0000… Gnomon gene   89006 267354 .     -      .     ID=gene-L… Chr   1.0
##  7 NC_0000… BestR… gene  134773 140566 .     -      .     ID=gene-L… Chr   1.0
##  8 NC_0000… BestR… gene  187891 187958 .     -      .     ID=gene-M… Chr   1.0
##  9 NC_0000… Gnomon gene  200442 203983 .     +      .     ID=gene-L… Chr   1.0
## 10 NC_0000… Gnomon gene  350706 476822 .     -      .     ID=gene-L… Chr   1.0
## # ℹ 37,468 more rows
## # ℹ 9 more variables: INSDC <chr>, `Size (Mb)` <dbl>, `GC%` <dbl>,
## #   Protein <dbl>, rRNA <dbl>, tRNA <dbl>, `Other RNA` <dbl>, Gene <dbl>,
## #   Pseudogene <dbl>
Question 6: Your answer should produce a tibble that looks like this;
## # A tibble: 25 × 2
##    Name  num_genes
##    <chr>     <int>
##  1 1.0        3673
##  2 2.0        2616
##  3 6.0        2115
##  4 11.0       2079
##  5 3.0        2061
##  6 19.0       1961
##  7 17.0       1883
##  8 12.0       1837
##  9 5.0        1797
## 10 7.0        1793
## # ℹ 15 more rows
Question 7: Your answer should produce a tibble that looks like this;
## # A tibble: 25 × 3
## # Groups:   Name [25]
##    Name  chr_order num_genes
##    <chr>     <int>     <int>
##  1 1.0           1      3673
##  2 2.0           2      2616
##  3 3.0           3      2061
##  4 4.0           4      1631
##  5 5.0           5      1797
##  6 6.0           6      2115
##  7 7.0           7      1793
##  8 8.0           8      1495
##  9 9.0           9      1542
## 10 10.0         10      1537
## # ℹ 15 more rows
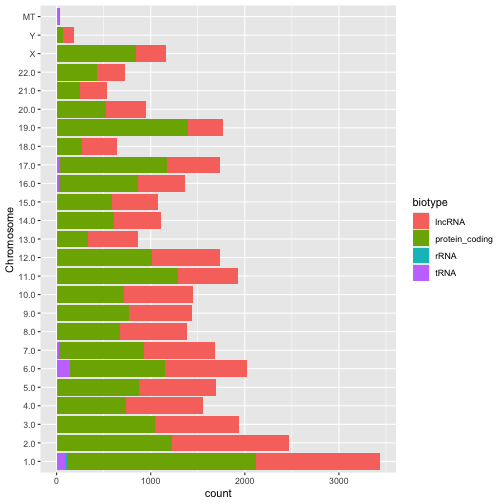
Question 8: Your answer should produce a plot that looks like this;
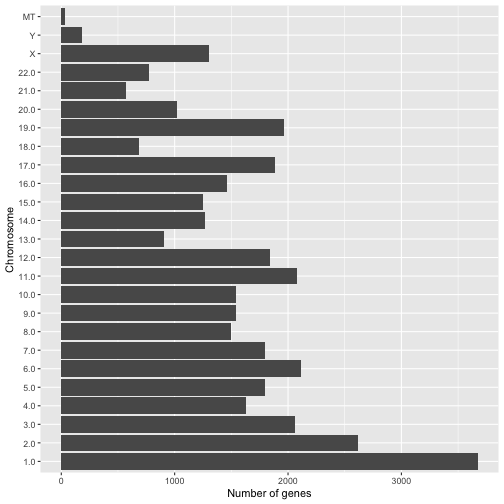
Question 9: Your answer should produce a plot that looks like this;
Question 10: Your answer should produce a plot that looks like this;